Enterprise SaaS

Helping organizations turn complex operational data into confident decisions.

Better decisions begin with better understanding.

Organizations pursuing ambitious sustainability goals often rely on fragmented systems, disconnected datasets, and manual reporting. Optos reimagined that experience by bringing operational intelligence into one unified platform—helping teams understand performance, identify opportunities, and make faster, more informed decisions.

Role
Lead Product Designer
Timeline
18 months · 2023–2024
Industry
Enterprise SaaS
Team
1 PM · 5 engineers · 1 data scientist · 1 researcher · sustainability SMEs
Why It Mattered

Before the answer,the tension that demanded one.

Organizations committed to operational efficiency and sustainability faced an unexpected problem: too much information. Data existed everywhere—understanding existed nowhere. Teams spent valuable time gathering inputs instead of acting on insight.

01

Fragmented Systems

Energy, carbon, IoT, weather, and utility data lived in independent tools with different formats and cadences.

02

Rear-View Reporting

Existing dashboards described the past. Customers needed a product that pointed toward the next decision.

03

High Cognitive Load

Dense interfaces forced users to interpret information before they could act, slowing every workflow.

04

Trust Gap

Without context or provenance, leadership hesitated to commit to recommendations from any single system.

We did not need more data. We needed a product that helped us understand it.
VP OF SUSTAINABILITY, NEXTERA ENERGY
The System

The shape of the problemmade visible.

Signature Visual · Sustainability Intelligence Network

Understanding the system before designing the solution.

Behind every sustainability decision lives a network of disconnected systems, operational data, environmental inputs, and organizational goals. Optos brings those relationships together into a single intelligent platform that surfaces meaningful insights instead of overwhelming information.

OPTOS
Intelligence Platform
Energy Sources
Weather
Carbon Reporting
IoT Sensors
Facilities
Utilities
Operational Systems
Compliance
AI Intelligence

The intelligence layer continuously transforms connected operational data into confident recommendations.

Pattern Recognition
Forecasting
Recommendations
Optimization
Confidence
Why It Mattered

The challenge wasn’t designing another dashboard. It was helping people understand relationships hidden across thousands of independent data points—transforming overwhelming complexity into confident decision making.

The Opportunity

The betsthat earned the build.

Problem

Sustainability and operational data was spread across dozens of systems, leaving teams to assemble understanding by hand before they could act.

Opportunity

A unified intelligence layer could replace fragmented reporting with a single, decision-led experience.

Outcome

A calm, confident enterprise product that helped operators, analysts, and executives understand complex systems well enough to make decisions on a weekly cadence.

The principles we held to.

  1. 01Reduce cognitive load.
  2. 02Surface meaningful insights.
  3. 03Support informed decisions.
  4. 04Visualize relationships, not just metrics.
  5. 05Design for enterprise scale.
Final Experience

The product.Revealed surface by surface.

The shipped product organizes the experience around user goals, not features. Each surface leads with the decision a persona is trying to make and earns trust through context, provenance, and clarity.

Goal 01

Understanding Operational Performance

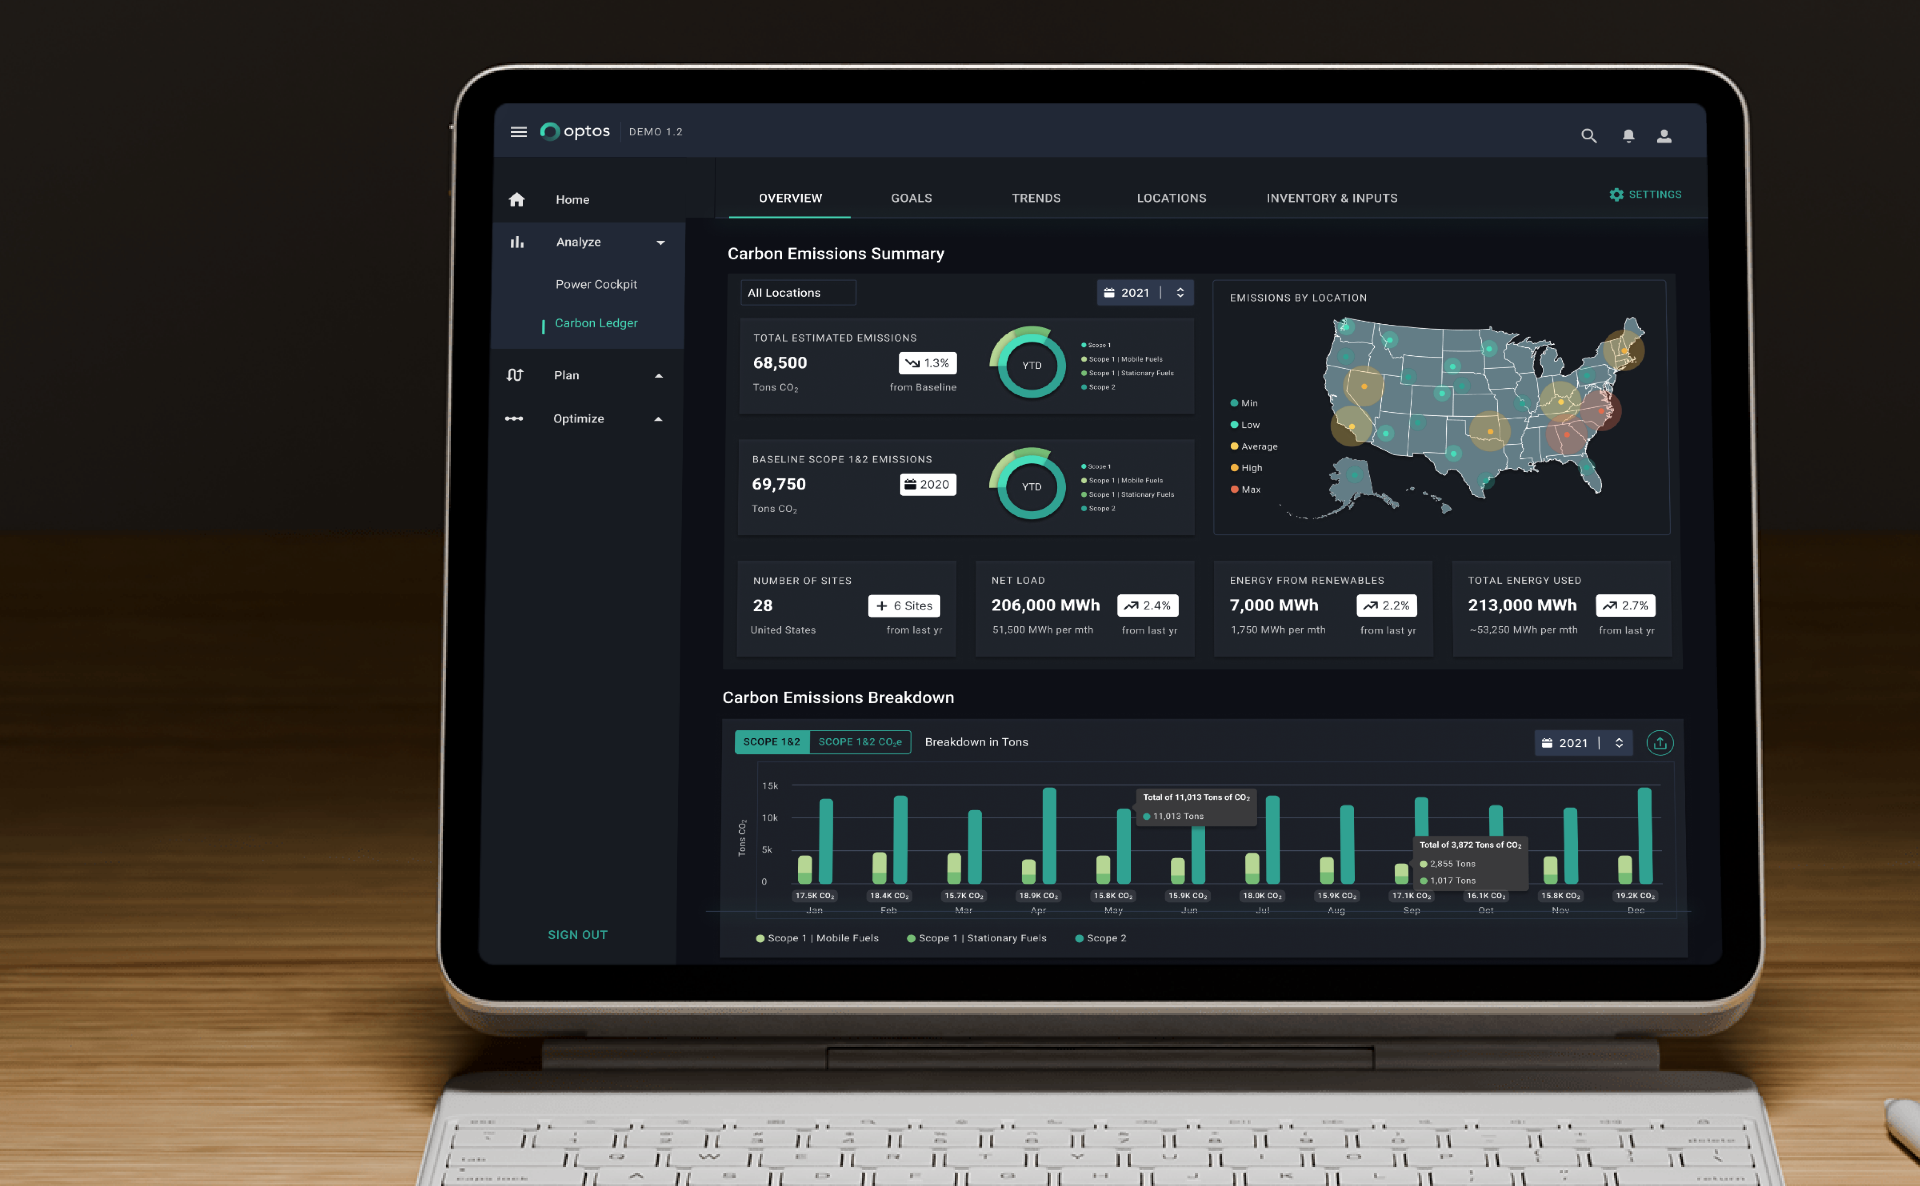
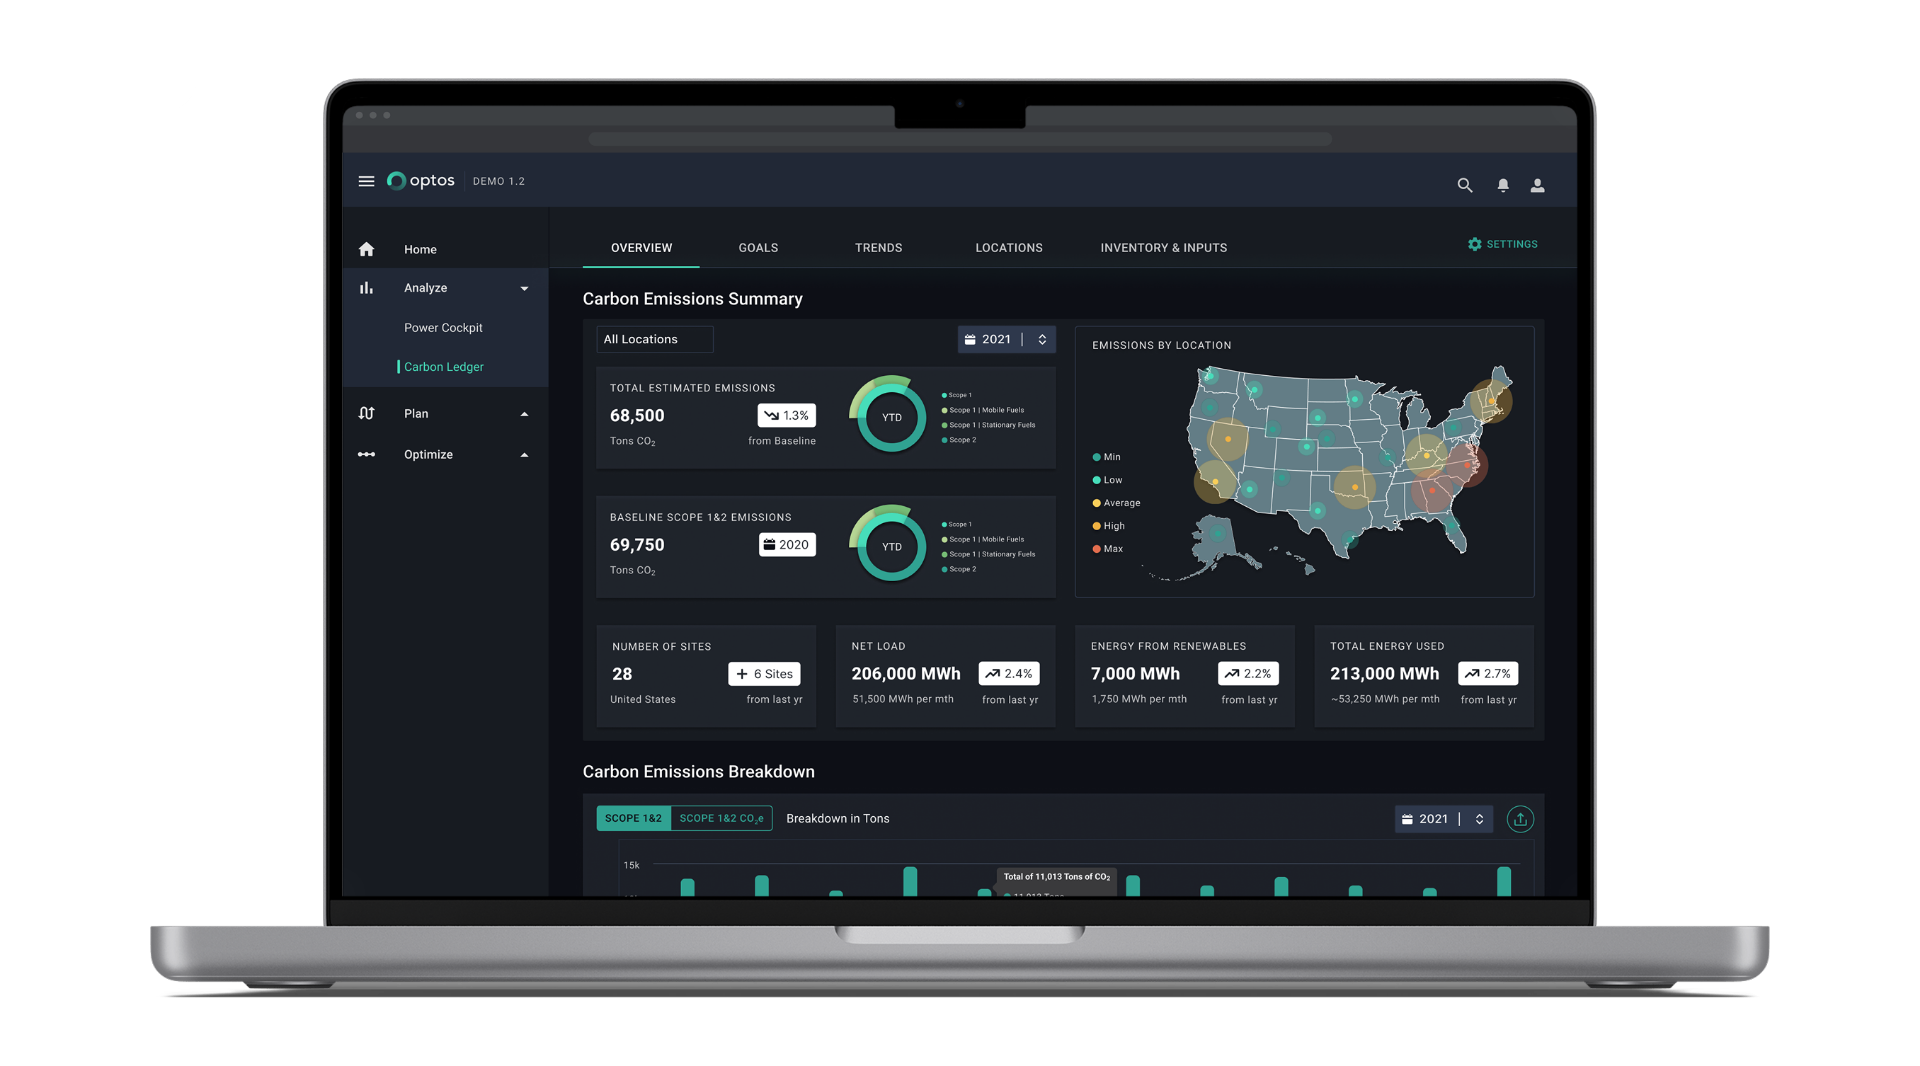
Optos Carbon Ledger overview dashboard with emissions summary, US location map, and site energy metrics
Problem

Teams could not see how facilities were performing without consolidating data manually.

Outcome

Leaders see how the organization is performing at a glance, with detail available only when it is needed.

Goal 02

Identifying Sustainability Opportunities

Problem
Opportunities were buried inside reports that few people had time to interpret.
Solution
Opportunity surfacing ranks where the biggest gains live, with the context needed to evaluate them quickly.
Impact
Teams move from searching for opportunities to evaluating the ones the product brings forward.
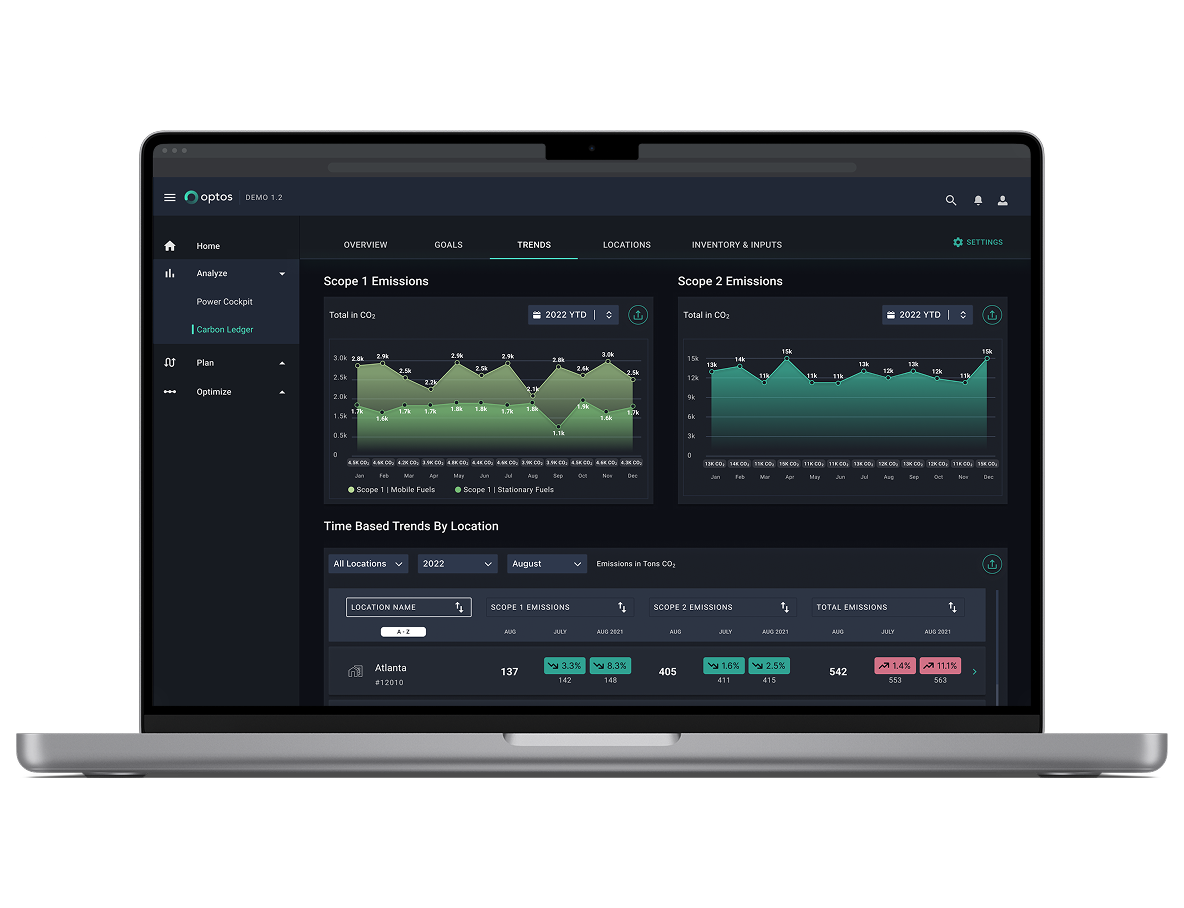
Optos Trends dashboard showing Scope 1 and Scope 2 emissions line charts alongside a time-based trends by location table
Goal 03

Exploring AI Recommendations

Problem
Recommendations were dismissed because users could not see why a model made a call.
Solution
Every recommendation exposes its inputs, confidence, and trade-offs, with one-tap accept, modify, or reject.
Impact
AI moved from a feature people ignored to a workflow people relied on.
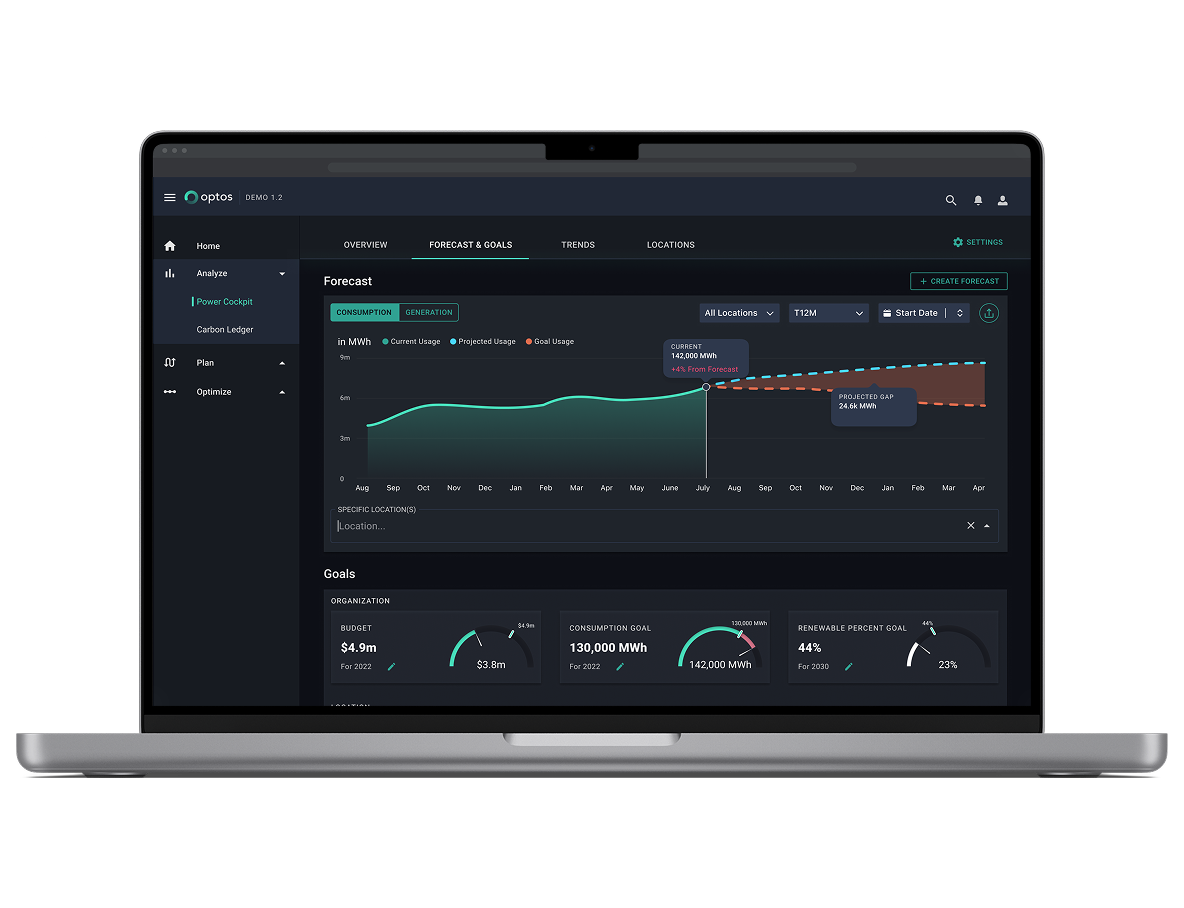
Optos Forecast & Goals dashboard showing a consumption forecast area chart with projected gap and organization goal gauges
Goal 04

Comparing Facility Performance

Problem
Side-by-side comparisons required exporting data and rebuilding views in spreadsheets.
Solution
A comparison surface aligns facilities by shared metrics, with normalization handled in the background.
Impact
Operators identify outliers and best performers without leaving the product.
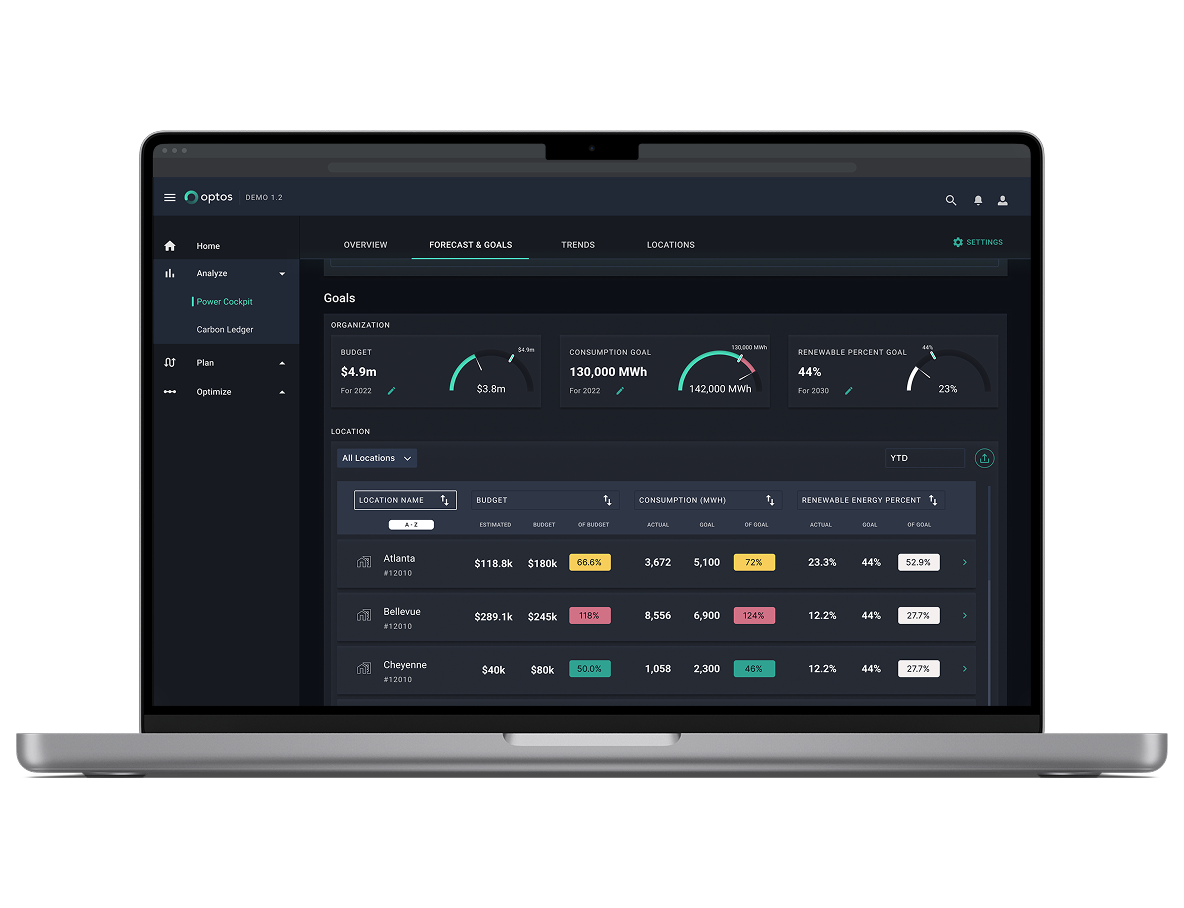
Optos Forecast & Goals dashboard with organization budget, consumption, and renewable percent gauges alongside a per-location performance breakdown table
Goal 05

Monitoring Progress Toward Goals

Problem
Long-horizon targets felt disconnected from the work happening this week.
Solution
A pathway view connects every accepted decision to its contribution against organizational goals.
Impact
Strategy and execution share the same surface, so progress is always visible.
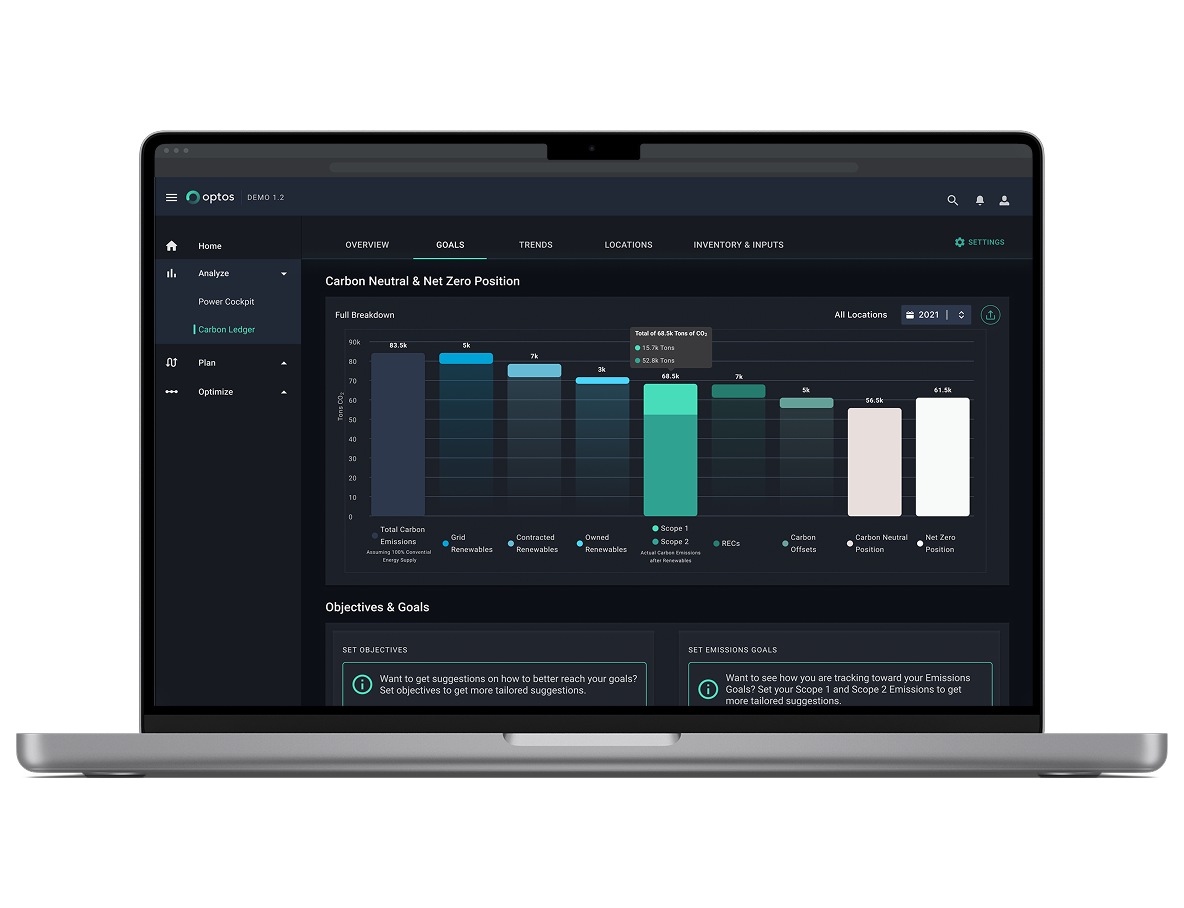
Optos Carbon Ledger Carbon Neutral & Net Zero Position full breakdown bar chart with objectives and emissions goals panels
Goal 06

Generating Meaningful Reports

Problem
Reporting consumed days of analyst time and often required rebuilding context from scratch.
Solution
Reports compose from the same objects the product is built on, with provenance and assumptions included by default.
Impact
Board-ready reporting shifted from a multi-day effort to a guided workflow.
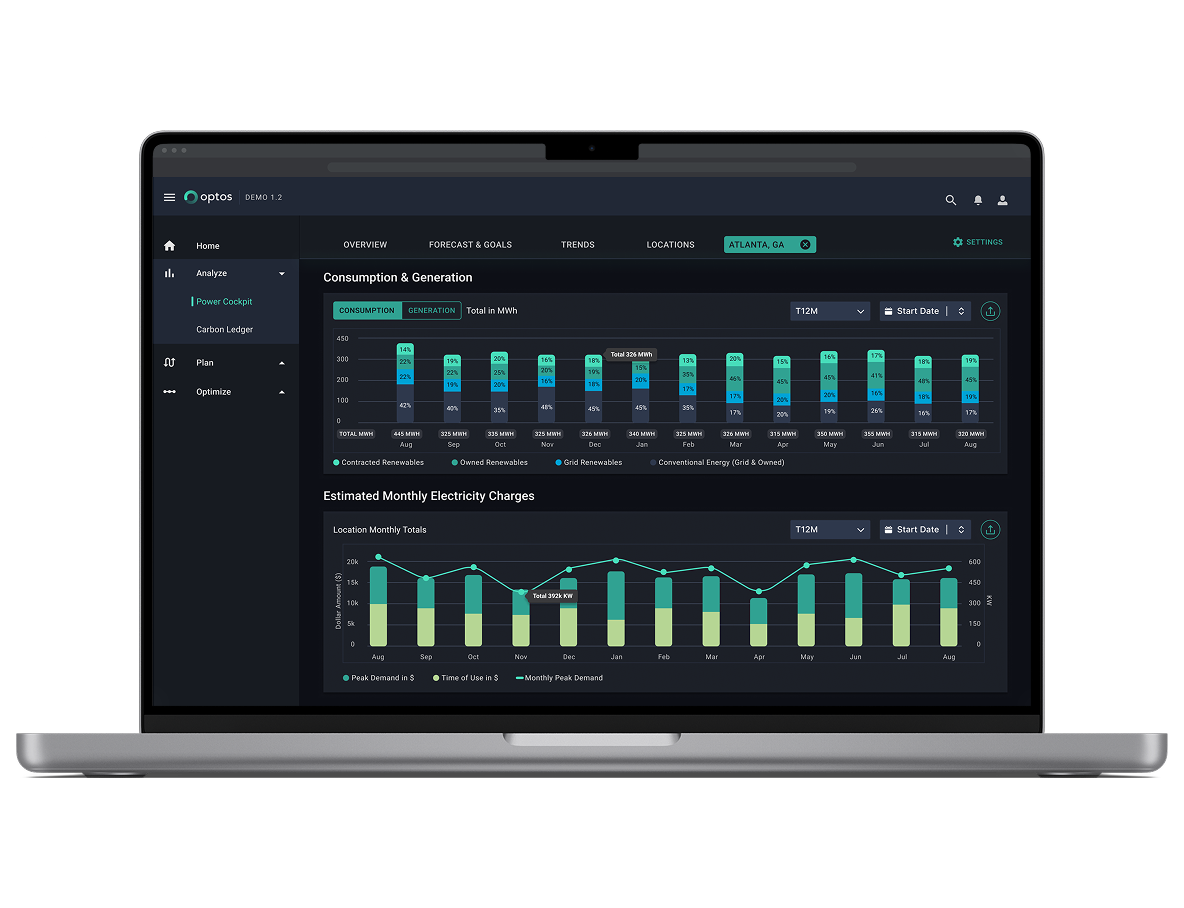
Optos Power Cockpit dashboard showing Consumption & Generation stacked bar chart and Estimated Monthly Electricity Charges chart
Design System

Built to outlast.Launch day.

Every surface ships from a shared system — tokens, components, and patterns documented so future teams can extend the product without re-deriving its rules.

Product Strategy
Enterprise UX
Information Architecture
Data Visualization
AI-Assisted Workflows
Design Systems
The Impact

The outcome.across the business.

Connected operational view

One

Replacing disconnected reporting tools with one shared platform.

Decision cadence

Weekly

Moving from retrospective reporting toward continuous operational awareness.

Operational intelligence

Predictive

Surfacing opportunities before they became operational issues.

Cross-functional workflows

Unified

Finance, Sustainability, Facilities, and Operations working from one source of truth.

Reporting overhead

Lower

Less spreadsheet stitching. More time acting on meaningful insights.

Executive confidence

Higher

Making enterprise-wide performance understandable at a glance.

Rather than creating another reporting dashboard, Optos reimagined how enterprise teams understand operational complexity. By connecting fragmented systems into a shared operational model, the platform helped teams spend less time gathering information and more time making confident decisions together.

Reflection

What worked.What I'd build next.

What changed

Organizing the product around user decisions rather than data sources. It gave every persona, surface, and AI recommendation a shared place to live.

What surprised me

How much value came from removing things. The biggest gains in clarity came from cutting metrics, not adding visualizations.

What I'd build next

I would invest even earlier in the explainability layer. Trust in AI recommendations compounded once provenance was visible, and the surfaces that lacked it lagged for months.

Next Chapter

Let's build the nextsuccess story.

Every case study in this portfolio began with a complex problem, an ambitious team, and a decision to build something better. If you’re solving the next one, I’d love to help write its success story.